
Analytics
FormSlug counts every redirect through one of your slugs and aggregates them into two views: a high-level Overview of your workspace, and a Per-slug breakdown with a 30-day trend chart.
Overview
Section titled “Overview”The Overview view is the dashboard’s home page. It shows at a glance:
- Total clicks across all slugs (all-time).
- Active slugs count.
- Top slugs by click count, with a simple bar chart.
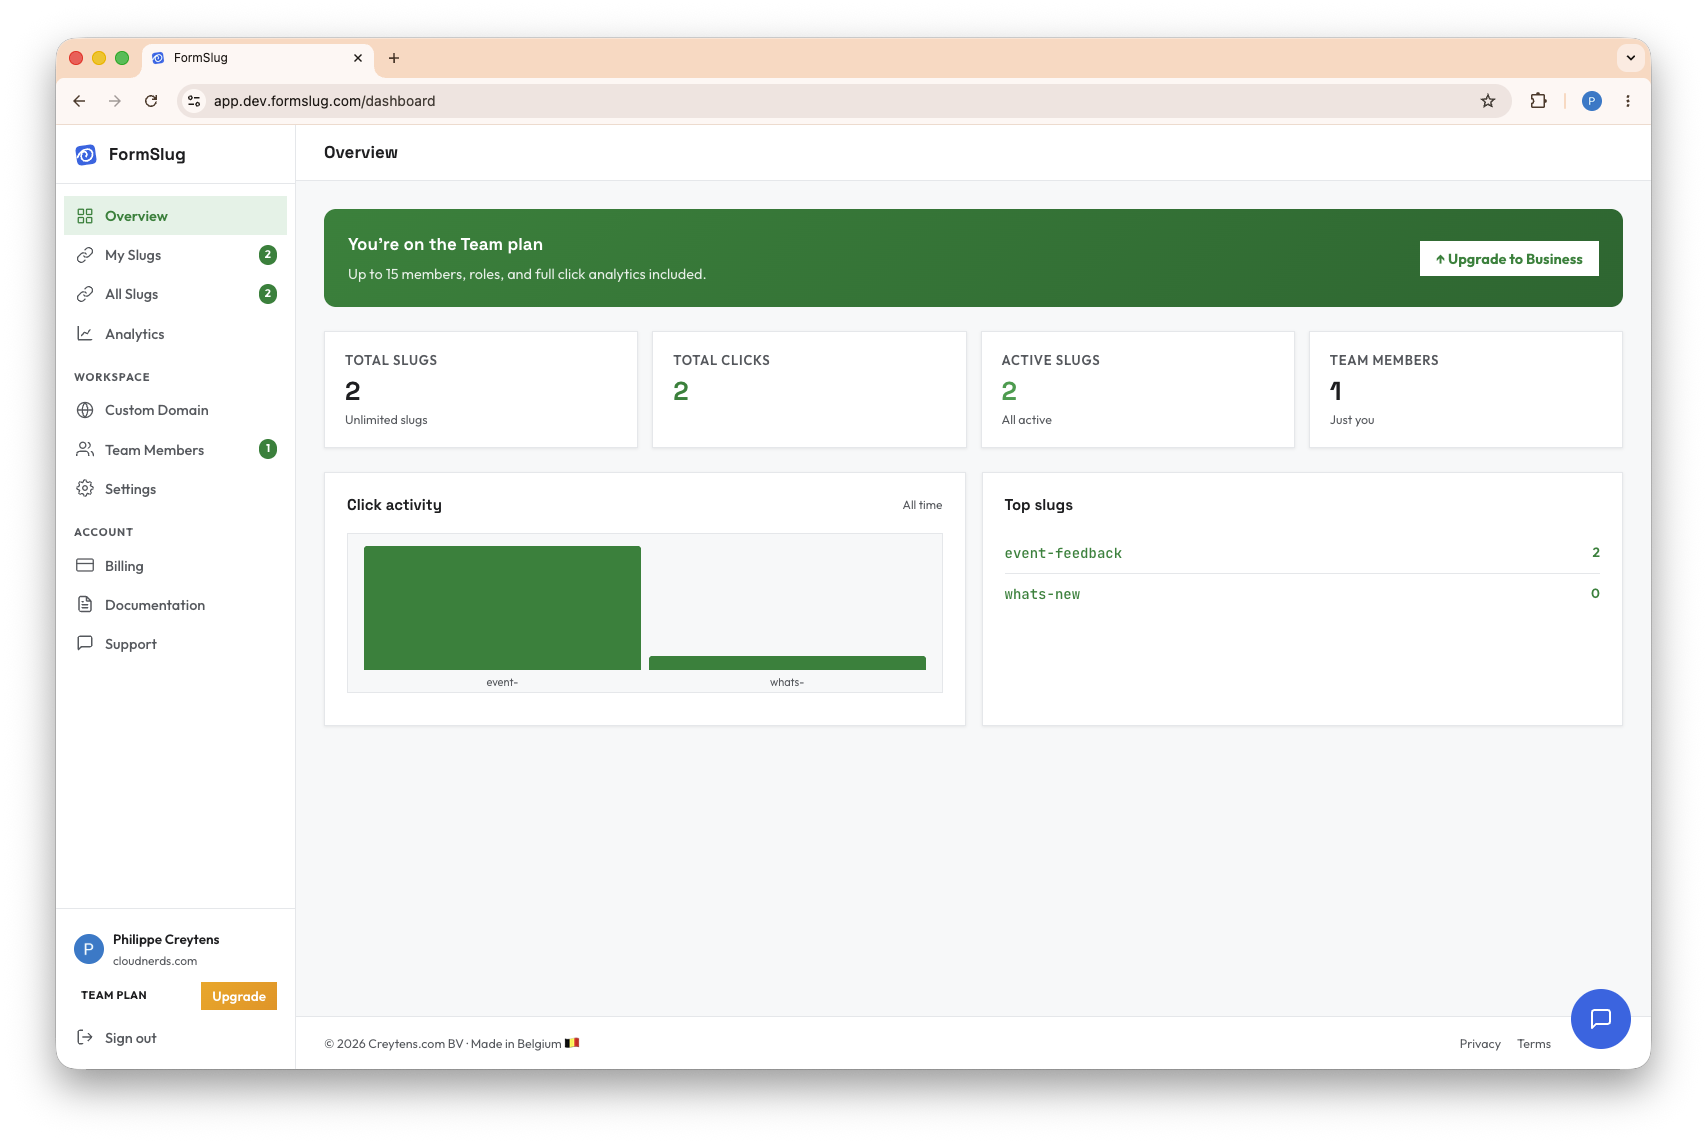
The Overview is available on every plan, including Free.
Per-slug analytics
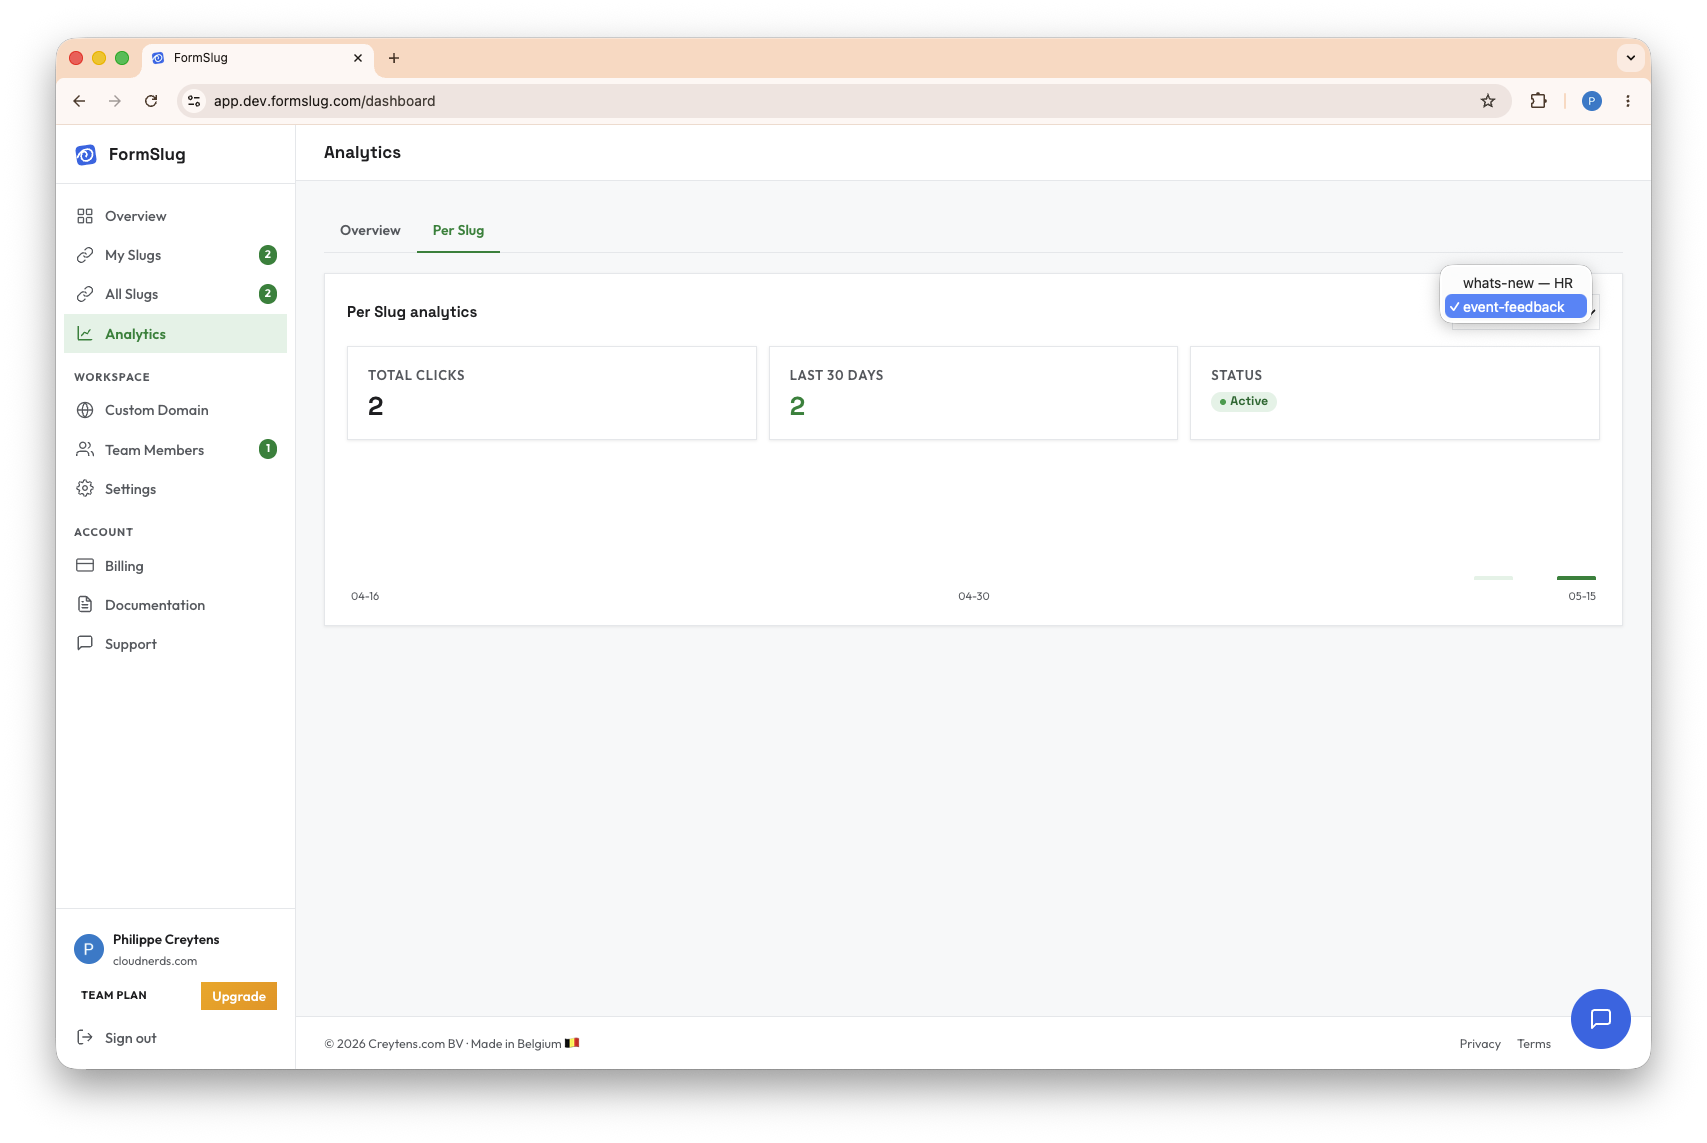
Section titled “Per-slug analytics”For a deeper look at a single slug — including how clicks have trended over the past 30 days — open the Analytics view.
- Open the FormSlug dashboard.
- In the left sidebar, click Analytics.
- Pick a slug from the dropdown at the top.
You’ll see:
- Total clicks for that slug.
- Status (active / paused).
- A 30-day bar chart of clicks per day.
Reading the numbers
Section titled “Reading the numbers”A few things to keep in mind:
- A click is one redirect through a slug. Visiting
go.formslug.com/feedbackonce = 1 click. - Rapid repeated clicks from the same browser won’t inflate the count — the redirect is cached, so clicking the same link multiple times in quick succession typically registers as just one click.
- Clicks are counted regardless of whether the visitor submits the form. To measure submissions, look at the responses in Google Forms itself.
- The 30-day chart shows the last 30 calendar days, ending today.
- There’s no per-visitor tracking — FormSlug doesn’t know who clicked, only that a click happened.
Export click data
Section titled “Export click data”To take the click numbers somewhere else (a spreadsheet, a BI tool), use the Export CSV button in My slugs. The export includes every slug’s click count.
Coming soon
Section titled “Coming soon”- Per-member analytics (Team plan and up): break clicks down by who created the slug.
What’s next
Section titled “What’s next”- Manage your slugs — pause underperforming slugs or rename them.
- Plans & subscription — unlock per-slug analytics on Pro and above.